Executive Summary
Stratified sampling divides a population into homogeneous subgroups (strata) then samples from each group, ensuring representation across all categories. Cluster sampling divides a population into naturally occurring groups (clusters) then randomly selects entire clusters to study. The key difference: stratified sampling requires knowing population characteristics beforehand, while cluster sampling works when complete population data is unavailable.
Use stratified sampling when you need precise estimates across known subgroups (age ranges, disease stages, income brackets). Use cluster sampling when geographical or organizational constraints make individual random sampling impractical (surveying schools, hospitals, or cities). Both methods reduce costs compared to simple random sampling, but stratified sampling typically provides more precise estimates while cluster sampling offers greater logistical efficiency.
This guide explains both methods with health research and machine learning examples, helping you choose the right approach for your data collection needs.
1. Quick Comparison: Stratified vs Cluster Sampling
Stratified sampling treats variation WITHIN groups as noise and variation BETWEEN groups as signal. You want each stratum to be internally homogeneous so differences between strata become clear.
Cluster sampling assumes similarity WITHIN groups and accepts variation BETWEEN groups. You select entire clusters because they're naturally occurring units (schools, cities, hospitals) that are logistically easier to sample than individuals.
Key Decision Rule
Ask yourself: "Do I know how my population divides into meaningful subgroups?"
YES, and those subgroups matter to my analysis → Stratified sampling
NO, but my population naturally clusters geographically or organizationally → Cluster sampling
YES, but I can't access individuals across all subgroups → Cluster sampling (practical constraint)
2. Stratified Sampling Explained
Definition
Stratified sampling divides a population into mutually exclusive subgroups (strata) based on shared characteristics, then draws random samples from each stratum proportionally or with equal allocation. The method ensures that every important subgroup appears in your final sample at its true population proportion or at a predetermined ratio.
How It Works
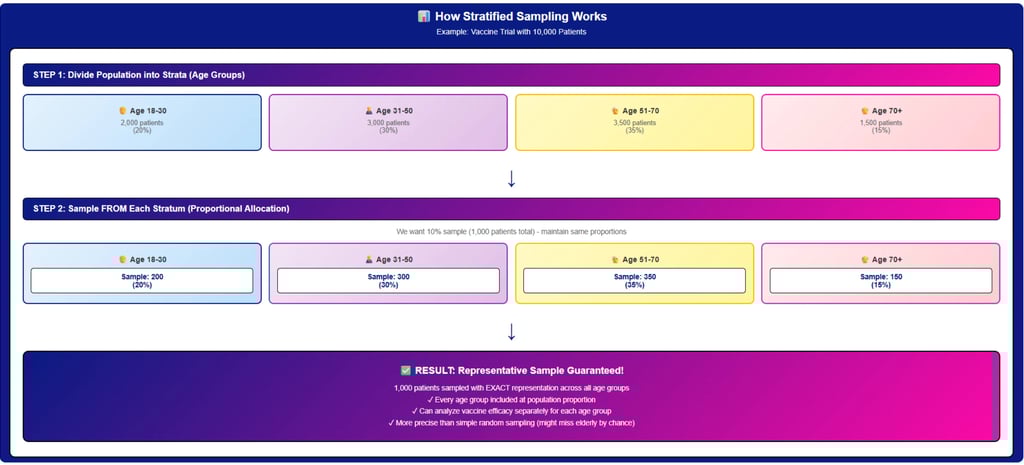
Step 1: Identify Stratification Variables Choose characteristics that correlate with your outcome of interest. In a vaccine efficacy study, you might stratify by age group (18-30, 31-50, 51-70, 70+) because immune response varies with age.
Step 2: Divide Population into Strata
Create non-overlapping groups. If studying 10,000 patients: 2,000 in age 18-30, 3,000 in age 31-50, 3,500 in age 51-70, and 1,500 age 70+.
Step 3: Determine Sample Size per Stratum
Proportional allocation: Sample size per stratum matches its population proportion. For a 10% sample (1,000 patients), draw 200 from 18-30, 300 from 31-50, 350 from 51-70, and 150 from 70+.
Equal allocation: Draw the same number from each stratum (250 per group) when you want equal precision across all strata regardless of their population sizes.
Step 4: Randomly Sample Within Each Stratum
Use simple random sampling within each stratum to select participants.
When to Use Stratified Sampling
Choose stratified sampling when:
Known subgroups exist that differ meaningfully on your outcome variable (disease prevalence by region, customer behavior by income level)
You need precise estimates for specific subgroups (vaccine efficacy in elderly vs young adults)
Small subgroups must be adequately represented (rare disease patients, minority populations in clinical trials)
You want to reduce sampling error compared to simple random sampling
Pros and Cons
Advantages:
Guarantees representation of all important subgroups
Reduces sampling error when strata are homogeneous
Allows separate analysis of each stratum
More precise estimates than simple random sampling with the same sample size
Disadvantages:
Requires advance knowledge of population characteristics
Needs a complete sampling frame with stratification variables
More complex to implement than simple random sampling
Can be expensive if strata are geographically dispersed
Health Research Example
A diabetes medication trial stratifies 5,000 patients by disease severity (mild, moderate, severe). Proportional stratified sampling ensures the final sample of 500 patients includes 200 mild cases (40%), 200 moderate (40%), and 100 severe (20%), matching population proportions. This guarantees sufficient data to detect treatment effects across all severity levels, whereas simple random sampling might undersample severe cases by chance.
3. Cluster Sampling Explained
Definition
Cluster sampling divides a population into naturally occurring groups (clusters), then randomly selects entire clusters to study. All individuals within selected clusters are included in the sample, or a random subsample is drawn from each selected cluster (two-stage cluster sampling).
How It Works
Step 1: Define Clusters
Identify natural groupings in your population. For a national health survey, clusters might be cities, hospitals, or census blocks. Clusters should be geographically or administratively convenient.
Step 2: Randomly Select Clusters
Use simple random sampling to choose clusters. If you have 200 hospitals nationwide and budget allows surveying 20 hospitals, randomly select 20 clusters.
Step 3: Sample Within Clusters
One-stage cluster sampling: Survey ALL individuals in selected clusters.
Two-stage cluster sampling: Randomly sample individuals WITHIN each selected cluster. This reduces data collection costs while maintaining probability sampling.
When to Use Cluster Sampling
Choose cluster sampling when:
No complete sampling frame exists for individuals, but you can list groups (all schools in a district but not all students)
Geographical dispersion makes individual sampling impractical (national health survey visiting 1,000 random addresses is prohibitively expensive)
Administrative units provide natural clustering (surveying employees by company, patients by hospital, students by school)
Budget constraints require concentrated data collection (visiting 10 cities is cheaper than visiting 100 random individuals nationwide)
Pros and Cons
Advantages:
Logistically simpler and cheaper than individual random sampling
Works without a complete individual-level sampling frame
Reduces travel and administrative costs
Practical for geographically dispersed populations
Disadvantages:
Higher sampling error than simple random sampling (individuals in same cluster are similar)
Requires larger sample sizes to achieve same precision as stratified sampling
Risk of unrepresentative results if selected clusters are atypical
Less precise estimates when clusters are internally homogeneous
Health Research Example
A COVID-19 prevalence study targets 50,000 residents across a country. Single-stage cluster sampling randomly selects 50 cities (clusters) from 500 total cities, then tests ALL residents in those 50 cities. This is far cheaper than randomly selecting 50,000 individuals nationwide because testing can be concentrated in 50 locations rather than dispersed across the entire country.
Alternatively, two-stage cluster sampling might select 100 cities, then randomly sample 500 residents within each selected city, still maintaining probability sampling while reducing costs further.
4. When to Use Each Method: Decision Framework
5. Real-World Examples in Health Research & ML
Example 1: Vaccine Trial Design (Stratified Sampling)
A pharmaceutical company tests a new influenza vaccine on 10,000 volunteers. Problem: Elderly individuals have weaker immune responses than younger adults. Simple random sampling might undersample elderly participants by chance, making it impossible to prove vaccine efficacy in this critical subgroup.
Solution: Stratified sampling by age. Divide volunteers into four age strata (18-30, 31-50, 51-70, 70+) and use proportional allocation to ensure each age group appears in the final sample at its true population proportion. This guarantees sufficient statistical power to detect vaccine efficacy across all age groups, which regulatory agencies require for approval.
Result: The study proves 85% efficacy in 18-30 age group, 78% in 31-50, 72% in 51-70, and 65% in 70+, with adequate sample sizes in each stratum to achieve statistical significance.
Example 2: Disease Prevalence Study (Cluster Sampling)
Researchers estimate malaria prevalence across 500 rural villages in a developing country. Problem: Visiting randomly selected individuals across 500 villages requires extensive travel and logistics.
Solution: Two-stage cluster sampling. Randomly select 50 villages (clusters), then within each village, randomly sample 100 residents for blood testing. This concentrates field teams in 50 locations instead of dispersing them across 500 villages.
Result: The study efficiently estimates regional malaria prevalence with acceptable precision while reducing field costs by 80% compared to individual random sampling across all villages.
Example 3: ML Training Data for Voice Biomarker Detection (Stratified Sampling)
An AI system detects Parkinson's disease from voice recordings. Problem: The training dataset contains 10,000 normal voice samples but only 500 Parkinson's samples. Training on this imbalanced dataset produces a model that simply predicts "no disease" for everyone, achieving 95% accuracy but failing to detect actual cases.
Solution: Stratified sampling with equal allocation. Create two strata (Parkinson's vs normal) and sample 500 recordings from each stratum. This balanced 1:1 dataset forces the model to learn distinguishing features instead of defaulting to the majority class.
Result: The model achieves 92% sensitivity (correctly identifies 92% of Parkinson's cases) and 88% specificity (correctly identifies 88% of normal cases), making it clinically useful for early disease screening. For more on voice biomarker applications, see our guide on voice biomarkers for Parkinson's disease detection.
Example 4: Wearable Sensor Data Collection (Cluster Sampling)
Researchers test wearable fall detection sensors for elderly care across 200 nursing homes. Problem: Deploying sensors to randomly selected individuals across 200 facilities requires extensive coordination and staff training.
Solution: Single-stage cluster sampling. Randomly select 20 nursing homes (clusters) and deploy sensors to ALL residents in those 20 facilities. This concentrates implementation in 20 locations, enabling intensive staff training and consistent data collection protocols.
Result: The study collects 6 months of sensor data from 2,000 residents across 20 facilities, demonstrating 94% accuracy in fall detection while maintaining practical implementation feasibility. Learn more about sensor applications in wearable technology for elderly health monitoring.
6. Common Mistakes to Avoid
Mistake 1: Confusing Stratification Variables with Clustering Variables
Wrong: Using age groups as clusters and sampling entire age groups.
Right: Age groups should be strata (sample FROM each age group) because age systematically affects outcomes. Clusters should be geographically or administratively convenient groups where internal similarity is acceptable.
Mistake 2: Creating Too Many Strata
Problem: Dividing a population of 1,000 into 50 strata leaves only 20 observations per stratum on average, producing unreliable estimates.
Solution: Limit strata to 3-10 meaningful groups. Combine similar categories if necessary.
Mistake 3: Assuming Cluster Sampling is as Precise as Stratified Sampling
Reality: Cluster sampling typically has 1.5-3x higher sampling error than stratified sampling because individuals within clusters are similar. You need larger sample sizes to compensate.
Solution: Calculate design effect (DEFF) to adjust sample size upward when using cluster sampling.
Mistake 4: Using Proportional Allocation When Equal Precision is Needed
Problem: Proportional stratified sampling gives large strata more weight. If you need equally precise estimates across all strata (regardless of size), proportional allocation undersamples small strata.
Solution: Use equal allocation or Neyman allocation (optimize sample size per stratum based on within-stratum variance).
Mistake 5: Treating Self-Selected Clusters as Random Samples
Problem: Surveying only "volunteer" hospitals or schools introduces selection bias. Facilities that volunteer may be systematically different (better resourced, more motivated) than those that decline.
Solution: Randomly select clusters and work to achieve high participation rates. Account for non-response bias in analysis.
FAQ
What is the main difference between stratified and cluster sampling?
Stratified sampling divides a population into homogeneous subgroups (strata) and samples from each group to ensure representation. Cluster sampling divides a population into naturally occurring groups (clusters) and randomly selects entire groups to study. The key difference: stratified sampling requires knowing population characteristics beforehand and treats subgroups as important categories requiring separate analysis. Cluster sampling works without complete population data and treats groups as logistically convenient units.
Stratified sampling typically provides more precise estimates because it guarantees representation across all important subgroups, while cluster sampling offers cost efficiency by concentrating data collection in selected locations. Use stratified when precision across subgroups matters; use cluster when logistical constraints make individual random sampling impractical.
Can you use stratified and cluster sampling together?
Yes. Stratified cluster sampling combines both methods. First, stratify the population into important subgroups (e.g., urban vs rural regions, public vs private hospitals). Then, within each stratum, use cluster sampling to randomly select groups (schools, hospitals, cities). Finally, sample individuals within selected clusters.
Example: A national education study might stratify schools by region (North, South, East, West) and school type (public, private). Within each stratum, randomly select 10 schools (cluster sampling). Within each selected school, randomly sample 50 students. This ensures regional representation (stratification) while maintaining cost efficiency (clustering).
Which method is more cost-effective?
Cluster sampling is generally more cost-effective than stratified sampling when your population is geographically dispersed. Concentrating data collection in randomly selected clusters (cities, schools, hospitals) reduces travel costs and administrative overhead compared to surveying individuals scattered nationwide.
However, stratified sampling can be more cost-effective per unit of precision. Because stratified sampling reduces sampling error, you need fewer total observations to achieve the same statistical power compared to cluster sampling. The "design effect" (DEFF) in cluster sampling often ranges from 1.5 to 3.0, meaning you need 1.5-3x more observations to match the precision of stratified or simple random sampling.
Choose cluster sampling when logistics dominate costs. Choose stratified sampling when data quality and precision matter more than collection efficiency.
When should I use simple random sampling instead?
Use simple random sampling when:
Your population is small and accessible (everyone on your team, all patients in a single hospital)
No meaningful subgroups require separate analysis
You don't face geographical or logistical constraints
You need the simplest possible sampling method
Simple random sampling provides an unbiased estimate and serves as the baseline for comparing other methods. However, both stratified and cluster sampling can improve efficiency when used appropriately. If your population has known subgroups that matter (age, disease stage), stratified sampling will be more precise than simple random sampling. If your population is dispersed (nationwide survey), cluster sampling will be cheaper than simple random sampling.
How do I choose the right stratification variable?
Select stratification variables that:
Correlate strongly with your outcome variable. If studying income, stratify by education level (correlated with income). If studying vaccine response, stratify by age (immune response varies with age).
Can be measured before sampling. You need to know each individual's stratum membership from your sampling frame. Don't stratify by variables you can only measure after data collection.
Create internally homogeneous strata. Within each stratum, individuals should be similar on your outcome variable. Between strata, individuals should differ.
Limit to 3-10 strata. Too many strata dilute sample sizes per stratum. Too few strata miss important variation.
Common stratification variables include age groups, geographical regions, disease severity levels, income brackets, and education levels. Avoid stratifying by variables unrelated to your research question; this adds complexity without improving precision.
What sample size do I need for cluster sampling?
Cluster sampling requires larger sample sizes than simple random or stratified sampling to achieve the same precision. Calculate required sample size using the design effect (DEFF):
n_cluster = n_simple × DEFF
Where:
n_simple = sample size needed for simple random sampling
DEFF = design effect accounting for within-cluster correlation
DEFF typically ranges from 1.5 to 3.0 depending on how similar individuals within clusters are. If individuals in the same cluster are very similar (small village where everyone has similar health outcomes), DEFF approaches 3.0. If clusters are internally diverse (large city with heterogeneous population), DEFF approaches 1.0.
Example: You need 400 observations for simple random sampling to achieve 95% confidence interval of ±5%. With DEFF = 2.0, you need 400 × 2.0 = 800 observations for cluster sampling to achieve the same precision. Consult a statistician to calculate DEFF for your specific application based on pilot data or published literature on similar studies.
Related Articles
Continue exploring sampling methods and data science applications:
Voice Biomarkers for Cognitive Decline Detection - How sampling methods apply to voice AI training data
Wearable Technology for Elderly Health Monitoring - Sensor data collection using cluster sampling in nursing homes
Multi-Modal AI Fusion for Health Applications - Combining multiple data sources with stratified sampling for balanced training sets
Sources and References
Sampling: Design and Analysis (3rd Edition) - Lohr, S. L. (2019). CRC Press. Comprehensive guide to probability sampling methods including stratified and cluster designs. Uqu.edu.sa link
Survey Sampling - Cochran, W. G. (1977). John Wiley & Sons. Classic text on sampling theory and practical applications. Scribd.com link
Stratified Sampling - Wikipedia. Overview of stratified sampling methods and applications. Wikipedia article
Cluster Sampling - Wikipedia. Explanation of cluster sampling designs and use cases. Wikipedia article
Design Effect in Survey Sampling - Kish, L. (1965). Survey Sampling. Statistical concept explaining increased variance in cluster sampling. Asasrms.org
Machine Learning with Imbalanced Data - Brownlee, J. (2020). Importance of stratified sampling for balanced training datasets. Machine Learning Mastery